Maps and Data - U.S. Public and Private Alternative Fueling Stations by Fuel Type
Find maps and charts showing transportation data and trends related to alternative fuels and vehicles.
OR
Sort by:
119 results
-
Laws & Incentives
-
-
Natural Gas Laws and Incentives by State
Displays states and their respective law and incentive counts related to the use of natural gas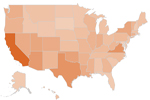
-
-
-
Propane Laws and Incentives by State
Displays states and their respective law and incentive counts related to the use of propane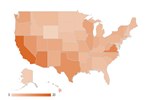
-
-
-
Renewable Diesel Laws and Incentives by State
Displays states and their respective law and incentive counts related to the use of renewable diesel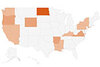
-
-
Clean Cities and Communities
-
-
Clean Cities and Communities Coalition Locations
Displays coalition locations and boundaries across the United States Last update April 2024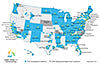
-
-
-
Clean Cities and Communities Project Awards and Matching Funds
Trend of competitive project awards and matching funds from 1998 to 2022 Last update February 2024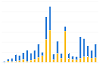
-
-
Clean Cities and Communities: Vehicles
-
-
Clean Cities and Communities Alternative Fuel Vehicle Inventory
Alternative fuel vehicle inventory reported by Clean Cities and Communities coalitions from 2004 to 2022 Last update February 2024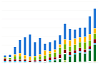
-
-
-
Clean Cities and Communities Energy Use Impact by AFV Type
Trend of energy impact by fuels used in alternative fuel vehicles (AFVs) from 2004 to 2022 Last update February 2024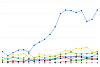
-
-
Clean Cities and Communities: Energy Use Impact
-
-
Clean Cities and Communities Annual Energy Use Impact
Trend of reduced fuel use and increased fuel diversity from 1994 to 2022 Last update February 2024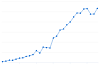
-
-
-
Clean Cities and Communities Cumulative Energy Use Impact
Cumulative trend of reduced fuel use and increased fuel diversity from 1994 to 2022 Last update February 2024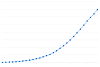
-
-
-
Clean Cities and Communities Energy Use Impact by AFV Type
Trend of energy impact by fuels used in alternative fuel vehicles (AFVs) from 2004 to 2022 Last update February 2024
-
-
-
Clean Cities and Communities Energy Use Impact by VMT Reduction and FE
Trend of energy impact by fuel economy (FE) improvements and reductions in vehicle miles traveled (VMT) from 2004 to 2022 Last update February 2024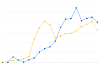
-
-
-
Clean Cities and Communities Energy Use Impact through Idle Reduction
Trend of energy impact by idle reduction policies and technologies from 2004 to 2022 Last update February 2024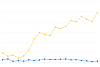
-
-
Regulated Fleets: State & Alt Fuel Providers
-
-
AFV Acquisitions by Regulated Fleets (by Fleet Type)
Trend of State & Alternative Fuel Provider (S&FP) alternative fuel vehicle (AFV) acquisitions by fleet type from 1992 to 2022 Last update June 2023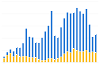
-
-
-
AFV Acquisitions by Regulated Fleets (by Fuel Type)
Trend of State & Alternative Fuel Provider (S&FP) alternative fuel vehicle (AFV) acquisitions by fuel type from 1992 to 2022 Last update June 2023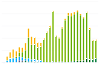
-
-
-
Annual Vehicle Credits Earned and Used by Regulated Fleets
Trend of State & Alternative Fuel Provider (S&FP) EPAct credits traded and transactions from 1999 to 2022 Last update June 2023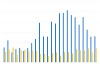
-
-
-
Biodiesel Purchases by EPAct-Regulated Fleets
Trend of State and Alternative Fuel Provider Biodiesel Purchases from 2000 to 2022 Last update June 2023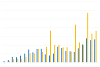
-
-
-
EPAct State & Alternative Fuel Provider Fleet Exemptions
Trend of State & Alternative Fuel Provider (S&FP) exemption requests and vehicles exempted from 1997 to 2022 Last update June 2023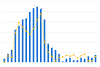
-
-
-
Vehicle Credits Traded by Regulated Fleets
Trend of State & Alternative Fuel Provider (S&FP) EPAct credits traded and transactions from 1997 to 2022 Last update June 2023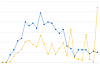
-
-
Regulated Fleets: Federal Fleets
-
-
AFV Requirements, Acquisitions, and Credits for Federal Agencies
Displays EPAct alternative fuel vehicle (AFV) acquisition requirements, total AFV acquisitions, and additional credits toward the acquisition requirements for federal agencies from fiscal years 2000 through 2019 Last update August 2021
-

U.S. Public and Private Alternative Fueling Stations by Fuel Type
| 1992 | 1993 | 1994 | 1995 | 1996 | 1997 | 1998 | 1999 | 2000 | 2001 | 2002 | 2003 | 2004 | 2005 | 2006 | 2007 | 2008 | 2009 | 2010 | 2011 | 2012 | 2013 | 2014 | 2015 | 2016 | 2017 | 2018 | 2019 | 2020 | 2021 | 2022 | |
| Biodiesel | 2 | 16 | 79 | 142 | 176 | 304 | 459 | 805 | 633 | 660 | 615 | 633 | 690 | 832 | 783 | 713 | 716 | 704 | 680 | 611 | 712 | 730 | 1193 | ||||||||
| CNG | 349 | 497 | 1042 | 1065 | 1419 | 1426 | 1268 | 1267 | 1217 | 1232 | 1166 | 1035 | 917 | 787 | 732 | 731 | 771 | 803 | 869 | 941 | 1155 | 1290 | 1495 | 1607 | 1730 | 1682 | 1621 | 1576 | 1549 | 1510 | 1399 |
| Electric | 188 | 194 | 310 | 486 | 490 | 558 | 693 | 873 | 830 | 671 | 588 | 465 | 432 | 440 | 484 | 626 | 2100 | 6200 | 8100 | 10712 | 13696 | 17723 | 19792 | 22826 | 26959 | 31738 | 50054 | 53492 | |||
| Ethanol (E85) | 2 | 7 | 32 | 37 | 68 | 71 | 40 | 49 | 113 | 154 | 149 | 188 | 200 | 436 | 762 | 1325 | 1699 | 1982 | 2296 | 2494 | 2519 | 2616 | 2840 | 3012 | 3095 | 3379 | 3627 | 3786 | 3946 | 4331 | 4426 |
| Hydrogen | 7 | 7 | 9 | 14 | 17 | 33 | 51 | 63 | 58 | 56 | 58 | 53 | 51 | 35 | 58 | 63 | 62 | 64 | 63 | 67 | 72 | ||||||||||
| LNG | 72 | 71 | 66 | 46 | 44 | 44 | 36 | 62 | 58 | 40 | 37 | 35 | 38 | 37 | 43 | 43 | 61 | 84 | 103 | 117 | 140 | 137 | 129 | 118 | 106 | 103 | 98 | ||||
| Methanol (M85) | 43 | 50 | 82 | 88 | 95 | 106 | 91 | 51 | 3 | ||||||||||||||||||||||
| Propane | 3297 | 3297 | 3299 | 3299 | 4252 | 4255 | 5318 | 4153 | 3268 | 3403 | 3431 | 3966 | 3689 | 2995 | 2619 | 2331 | 2110 | 2420 | 2604 | 2551 | 2644 | 2967 | 2931 | 3749 | 3654 | 3510 | 3319 | 3176 | 2956 | 2805 | 2713 |
| Renewable Diesel | 573 |
Notes: Between 2011 and 2013, the electric vehicle charging counts are an estimate of the number of geographic locations (i.e., station locations) based on the number of electric vehicle supply equipment (EVSE) ports because station counts were not captured in these years. See U.S. Public and Private Electric Vehicle Charging Infrastructure for counts of both EVSE ports and station locations.
This chart shows the trend of U.S. public and private alternative fueling stations by fuel type. Propane stations were the most numerous until 2011 when they were surpassed by electric vehicle charging stations. The growth in charging stations accelerated starting in 2011 following the 2010 increase of electric vehicles offered by major automakers. In 2021 alone, the number of charging stations grew by more than 50%. The number of charging stations is expected to increase as the population of electric vehicles continues to grow. The number of E85 stations has been increasing steadily since 2004 as the number of flex fuel vehicles available from major manufacturers has increased. The number of compressed natural gas (CNG) stations decreased between 1996 and 2006 (despite the increase in CNG sales during this time) largely because the average station size was increasing. CNG station counts also decreased after 2016 because of station closures, high repair and operating costs, and fleets transitioning away from CNG. The number of propane stations has also steadily decreased since 2016, which can be attributed to stations beginning to offer only bottle fueling and discontinuing vehicle fueling. Renewable diesel station data collection began in 2022, so all renewable diesel stations are counted as being added in 2022 even though they may have opened in prior years.
To view more details, notes, and acronyms, please download the Excel spreadsheet.
Print