Maps and Data
Find maps and charts showing transportation data and trends related to alternative fuels and vehicles.
OR
-
-
U.S. Biodiesel Production, Exports, and Consumption
Trend of biodiesel production, exports, and consumption from 2001 to 2023 Last update April 2024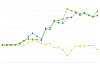
-
-
-
Biodiesel Fueling Station Locations by State
Displays states and their respective biodiesel station counts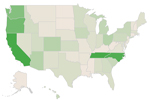
-
-
-
Biodiesel Laws and Incentives by State
Displays states and their respective law and incentive counts related to the use of biodiesel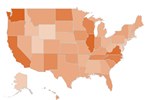
-
-
-
Biodiesel Purchases by EPAct-Regulated Fleets
Trend of State and Alternative Fuel Provider Biodiesel Purchases from 2000 to 2022 Last update June 2023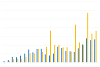
-
-
-
U.S. Public and Private Alternative Fueling Stations by Fuel Type
Trend of alternative fueling station counts by fuel type in the United States from 1992 to 2022 Last update January 2023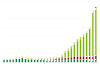
-
-
-
Total Advanced Biofuel RFS2 Mandates and Net RINs Generated
Displays yearly Renewable Fuel Standard (RFS) mandates from Environmental Protection Agency (EPA) volume requirements, and net Renewable Identification Numbers (RINs) generated Last update April 2024
-
-
-
Light-Duty AFV, HEV, and Diesel Model Offerings, by Technology/Fuel
Trend of vehicle models incorporating various advanced technologies or alternative fuels, from 1991 through 2022 Last update January 2023
-
-
-
U.S. Soybean and Corn Prices
Trend of soybean and corn prices, adjusted for inflation, from 2002 to 2021 Last update January 2023
-
-
-
Greenhouse Gas Reductions in Light- and Heavy-Duty Vehicles
Compares the greenhouse gases emitted by various fuels over their lifecycle when achieving the same objectives in light- and heavy-duty vehicles. Last update November 2022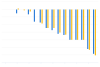
-
-
-
Average Retail Fuel Prices in the United States
Trend of alternative and traditional motor fuel prices from 2000 to 2024 Last update February 2024
-
-
-
AFV and HEV Model Offerings, by Manufacturer
Trend of alternative fuel vehicle (AFV) and hybrid electric vehicle (HEV) models by manufacturer, 1991-2022 Last update October 2022
-
-
-
Vehicle Weight Classes & Categories
Charts illustrate the vehicle weight classes and categories used by the Federal Highway Administration (FHWA), the U.S. Census Bureau, and the U.S. Environmental Protection Agency (EPA). Last update June 2012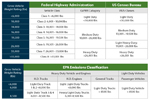
-
-
-
Total RFS2 Mandates and Net RINs Generated
Displays yearly Renewable Fuel Standard (RFS) mandates from Environmental Protection Agency (EPA) volume requirements, and net Renewable Identification Numbers (RINs) generated Last update April 2024
-
-
-
Clean Cities and Communities Coalition Locations
Displays coalition locations and boundaries across the United States Last update April 2024
-
-
-
Clean Cities and Communities Energy Use Impact by AFV Type
Trend of energy impact by fuels used in alternative fuel vehicles (AFVs) from 2004 to 2022 Last update February 2024
-
-
-
U.S. Production, Consumption, and Trade of Ethanol
Trend of total ethanol fuel production and consumption from 2000 to 2023 Last update January 2024
-
-
-
Clean Cities and Communities Annual Energy Use Impact
Trend of reduced fuel use and increased fuel diversity from 1994 to 2022 Last update February 2024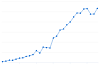
-
-
-
Transit Buses by Fuel Type
Trend of buses powered by various fuels in the United States, 2007-2019 Last update July 2021
-
-
-
RFS2 Mandates and Net RINs Generated for Cellulosic Biofuels
Displays yearly Renewable Fuel Standard (RFS) mandates from Environmental Protection Agency (EPA) volume requirements, and net Renewable Identification Numbers (RINs) generated Last update April 2024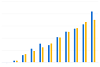
-
-
-
Renewable Fuel RFS2 Mandates and Net RINs Generated
Displays yearly Renewable Fuel Standard (RFS) mandates from Environmental Protection Agency (EPA) volume requirements, and net Renewable Identification Numbers (RINs) generated Last update April 2024
-
-
-
Clean Cities and Communities Cumulative Energy Use Impact
Cumulative trend of reduced fuel use and increased fuel diversity from 1994 to 2022 Last update February 2024
-
-
-
Law and Incentive Additions by Fuel/Technology Type
Trend of state law and incentive enactments, listed by the targeted technology or fuel type, from 2002 to 2023 Last update April 2024
-
-
-
Renewable Diesel Fueling Station Locations by State
Displays states and their respective renewable diesel station counts
-
-
-
AFV Requirements, Acquisitions, and Credits for Federal Agencies
Displays EPAct alternative fuel vehicle (AFV) acquisition requirements, total AFV acquisitions, and additional credits toward the acquisition requirements for federal agencies from fiscal years 2000 through 2019 Last update August 2021
-

U.S. Biodiesel Production, Exports, and Consumption
| 2001 | 2002 | 2003 | 2004 | 2005 | 2006 | 2007 | 2008 | 2009 | 2010 | 2011 | 2012 | 2013 | 2014 | 2015 | 2016 | 2017 | 2018 | 2019 | 2020 | 2021 | 2022 | 2023 | |
| Production | 8.577 | 10.484 | 14.21 | 27.982 | 90.787 | 250.439 | 489.825 | 678.106 | 515.802 | 343.434 | 967.4280000000001 | 990.711 | 1359.456 | 1279 | 1263 | 1568 | 1596 | 1857 | 1725 | 1815 | 1709 | 1622 | 1699 |
| Net Exports | -1.68 | -5.879999999999999 | 0.6720000000000006 | 1.134 | -0.04199999999999982 | -10.458 | 136.122 | 374.556 | 194.88 | 85.00800000000001 | 38.178 | 92.52600000000001 | -146.034 | -109.368 | -264.936 | -620.802 | -300.132 | -62.958 | -56.616 | -51.49199999999999 | -23.226 | -11.71799999999999 | -249.858 |
| Consumption | 10.213 | 16.168 | 13.533 | 26.878 | 90.827 | 260.584 | 353.708 | 303.556 | 321.832 | 260.075 | 885.877 | 899.046 | 1428.84 | 1417 | 1494 | 2085 | 1985 | 1904 | 1811 | 1864 | 1710 | 1658 | 1939 |
Source: U.S. Energy Information Administration (EIA) Monthly Energy Review, Table 10.4
This chart shows trends in U.S. biodiesel production, exports, and consumption from 2001 to 2023. Exports of biodiesel peaked in 2008 primarily because of an unintended effect of a biodiesel tax credit in the European Union. Exports then dropped after the effect was eliminated. The increased production and consumption from 2011 onward was largely driven by the Renewable Fuel Standard. In more recent years, production and consumption have declined, potentially impacted by the increase in renewable diesel in the market.
To view more details, notes, and acronyms, please download the Excel spreadsheet.
Print