Maps and Data - Average Annual Fuel Use by Vehicle Type
Find maps and charts showing transportation data and trends related to alternative fuels and vehicles.
OR
Sort by:
119 results
-
Fuels & Infrastructure: Fuel Trends
-
-
Average Annual Retail Fuel Price of Gasoline
Trend of gasoline prices, actual and inflation-adjusted, from 1950 to 2023 Last update January 2024
-
-
-
Average Renewable Diesel and Diesel Fuel Prices in California
Trend of renewable diesel and diesel motor fuel prices in California from 2017 to 2024 Last update February 2024
-
-
-
Average Retail Fuel Prices in the United States
Trend of alternative and traditional motor fuel prices from 2000 to 2024 Last update February 2024
-
-
-
Change in U.S. Vehicle Registration Counts
Trend of light-duty vehicle registrations by fuel type, measured in percent change from 2016 through 2020 Last update September 2021
-
-
-
Consumption of Natural Gas in the United States
U.S. natural gas consumption by end use in 2022 Last update January 2024
-
-
-
Energy Use by Transportation Mode and Fuel Type
Amount of energy consumed through different transportation modes, 2019 Last update May 2023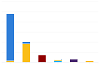
-
-
-
Fuel Taxes by Country
Comparison of gasoline and diesel taxes in Organization for Economic Cooperation and Development countries Last update March 2019
-
-
-
Fuel Use by Transportation Mode in 2019
Breakdown of fuel used in the United States by transportation mode, 2019 Last update May 2023
-
-
-
Global Ethanol Production by Country or Region
Quantity of ethanol produced by country/region from 2007 to 2022 Last update January 2024
-
-
-
Renewable Diesel Production and Consumption
Renewable diesel domestic production and consumption from 2013 to 2022 Last update November 2023
-
-
-
Sustainable Aviation Fuel Estimated Consumption
Estimated U.S. consumption of sustainable aviation fuel from 2016 to 2022 Last update April 2023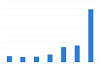
-
-
-
U.S. Biodiesel Production, Exports, and Consumption
Trend of biodiesel production, exports, and consumption from 2001 to 2023 Last update April 2024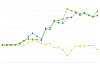
-
-
-
U.S. Crude Oil Imports by Country of Origin
Quantity of oil imports by country of production, from 1973 to 2023 Last update December 2023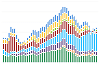
-
-
-
U.S. Production, Consumption, and Trade of Ethanol
Trend of total ethanol fuel production and consumption from 2000 to 2023 Last update January 2024
-
-
-
U.S. Production, Consumption, and Trade of Petroleum Products
Trend of total petroleum product production, consumption, and trade from 1949 to 2023 Last update November 2023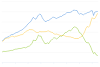
-
-
-
U.S. Renewable Diesel Imports
Renewable diesel fuel imports to the United States from 2015 to 2022 Last update November 2023
-
-
Fuels & Infrastructure: Emissions
-
-
Greenhouse Gas Emissions by Economic Sector
Trend of U.S. greenhouse gas emission for each economic sector Last update August 2022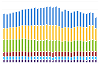
-
-
Fuels & Infrastructure: Alternative Fueling Stations
-
-
Biodiesel Fueling Station Locations by State
Displays states and their respective biodiesel station counts
-
-
-
Compressed Natural Gas Fueling Stations by State
Displays states and their respective compressed natural gas (CNG) station counts
-
-
-
E85 Fueling Station Locations by State
Displays states and their respective E85 station counts
-
-
-
Electric Vehicle Charging Ports by State
Displays states and their respective EV charging port counts
-
-
-
Hydrogen Fueling Station Locations by State
Displays states and their respective hydrogen station counts
-
-
-
Liquefied Natural Gas Fueling Stations by State
Displays states and their respective liquefied natural gas (LNG) station counts
-
-
-
Propane Fueling Station Locations by State
Displays states and their respective propane station counts
-
-
-
Renewable Diesel Fueling Station Locations by State
Displays states and their respective renewable diesel station counts
-

Average Annual Fuel Use by Vehicle Type
| Transit Bus | Class 8 Truck | Refuse Truck | Demand Response | Delivery Truck | School Bus | Light Truck/Van | Car | Motorcycle | |
| Annual Fuel Use (GGE) | 9605.263157894737 | 10745.47151548672 | 10089 | 4157 | 1765.170670037927 | 2122.567577343204 | 635.8426966292135 | 433.3196721311476 | 45.56818181818182 |
Source:
This chart shows average annual fuel use (per vehicle) for major vehicle categories in the United States. The metric used is gasoline gallon equivalents (GGEs), representing a quantity of fuel with the same amount of energy contained in a gallon of gasoline. The two factors affecting the average annual fuel use of a vehicle are the average miles traveled per year (correlative) and the fuel economy of the vehicle (inversely correlative). Transit buses, which are relatively inefficient because of their stop-and-go drive cycles and heavy loads, consume more fuel on average than any other vehicle type. Class 8 trucks, which typically travel long distances carrying heavy loads, use the second-largest amount of fuel. Refuse trucks, like transit buses, are inefficient because of their heavy loads and stop-and-go drive cycles. The last three vehicle types are owned by individual consumers, and they each use a fraction of the fuel consumed by fleet-based vehicles, on a per-vehicle basis. See also Average Annual Vehicle Miles Traveled by Major Vehicle Category and Average Fuel Economy by Major Vehicle Category.
- Federal Highway Administration Highway Statistics 2021, Table VM-1.
- World Resources Institute Electric School Bus Initiative, Recommended total cost of ownership parameters for electric school buses, Table 1Highway Statistics 2021, Table VM-1.
- Gordon, Deborah, Juliet Burdelski, and James S. Cannon. Greening Garbage Trucks: New Technologies for Cleaner Air. Inform, Inc. 2003.
- Calculated from statistics found in American Public Transit Association's 2022 Public Transportation Fact Book.
- To see additional references, download the Excel spreadsheet.
To view more details, notes, and acronyms, please download the Excel spreadsheet.
Print