Ethanol Production and Distribution
Ethanol is a domestically produced alternative fuel most commonly made from corn in the United States. It is also made from cellulosic feedstocks, such as crop residues and wood—though this is not as common. U.S. ethanol plants are concentrated in the Midwest because of the proximity to corn production. Plants outside the Midwest typically receive corn by rail or use other feedstocks and are located near large population centers.
Production
The production method of ethanol depends on the type of feedstock used. The process is shorter for starch- or sugar-based feedstocks than with cellulosic feedstocks.
Starch- and Sugar-Based Ethanol Production
Most ethanol in the United States is produced from starch-based crops by dry- or wet-mill processing. Nearly 90% of ethanol plants are dry mills due to lower capital costs. Dry milling is a process that grinds corn into flour and ferments it into ethanol with coproducts of distillers grains and carbon dioxide. Wet-mill plants primarily produce corn sweeteners, along with ethanol and several other coproducts (such as corn oil and starch). Wet mills separate starch, protein, and fiber in corn prior to processing these components into products, such as ethanol.
Cellulosic Production
Making ethanol from cellulosic feedstocks—such as grass, wood, and crop residues—is a more involved process than using starch-based crops. There are two primary pathways to produce cellulosic ethanol: biochemical and thermochemical. The biochemical process involves a pretreatment to release hemicellulose sugars followed by hydrolysis to break cellulose into sugars. Sugars are fermented into ethanol and lignin is recovered and used to produce energy to power the process. The thermochemical conversion process involves adding heat and chemicals to a biomass feedstock to produce syngas, which is a mixture of carbon monoxide and hydrogen. Syngas is mixed with a catalyst and reformed into ethanol and other liquid coproducts.
To read more about the conversion process, see Process Design and Economics for Biochemical Conversion of Lignocellulosic Biomass to Ethanol: Dilute-Acid Pretreatment and Enzymatic Hydrolysis of Corn Stover and Process Design and Economics for Biochemical Conversion of Lignocellulosic Biomass to Ethanol: Thermochemical Pathway by Indirect Gasification and Mixed Alcohol Synthesis.
Distribution
Most U.S. ethanol plants are concentrated in the Midwest, but gasoline consumption is highest along the East and West Coasts. According to the U.S. Energy Information Administration, more than 90% of ethanol is transported by train or truck. A tanker truck can carry 8,000 to 10,000 gallons of ethanol, and one rail car can carry approximately 30,000 gallons of ethanol. The remaining 10% is mainly transported by barge, with minimal amounts transported by pipeline. The United States consumed nearly 14 billion gallons of ethanol in 2022.
Ethanol, gasoline blendstock, and additives are delivered separately to fuel terminals where they are blended into fuel trucks for delivery to stations.
Schematic of Fuel Distribution System
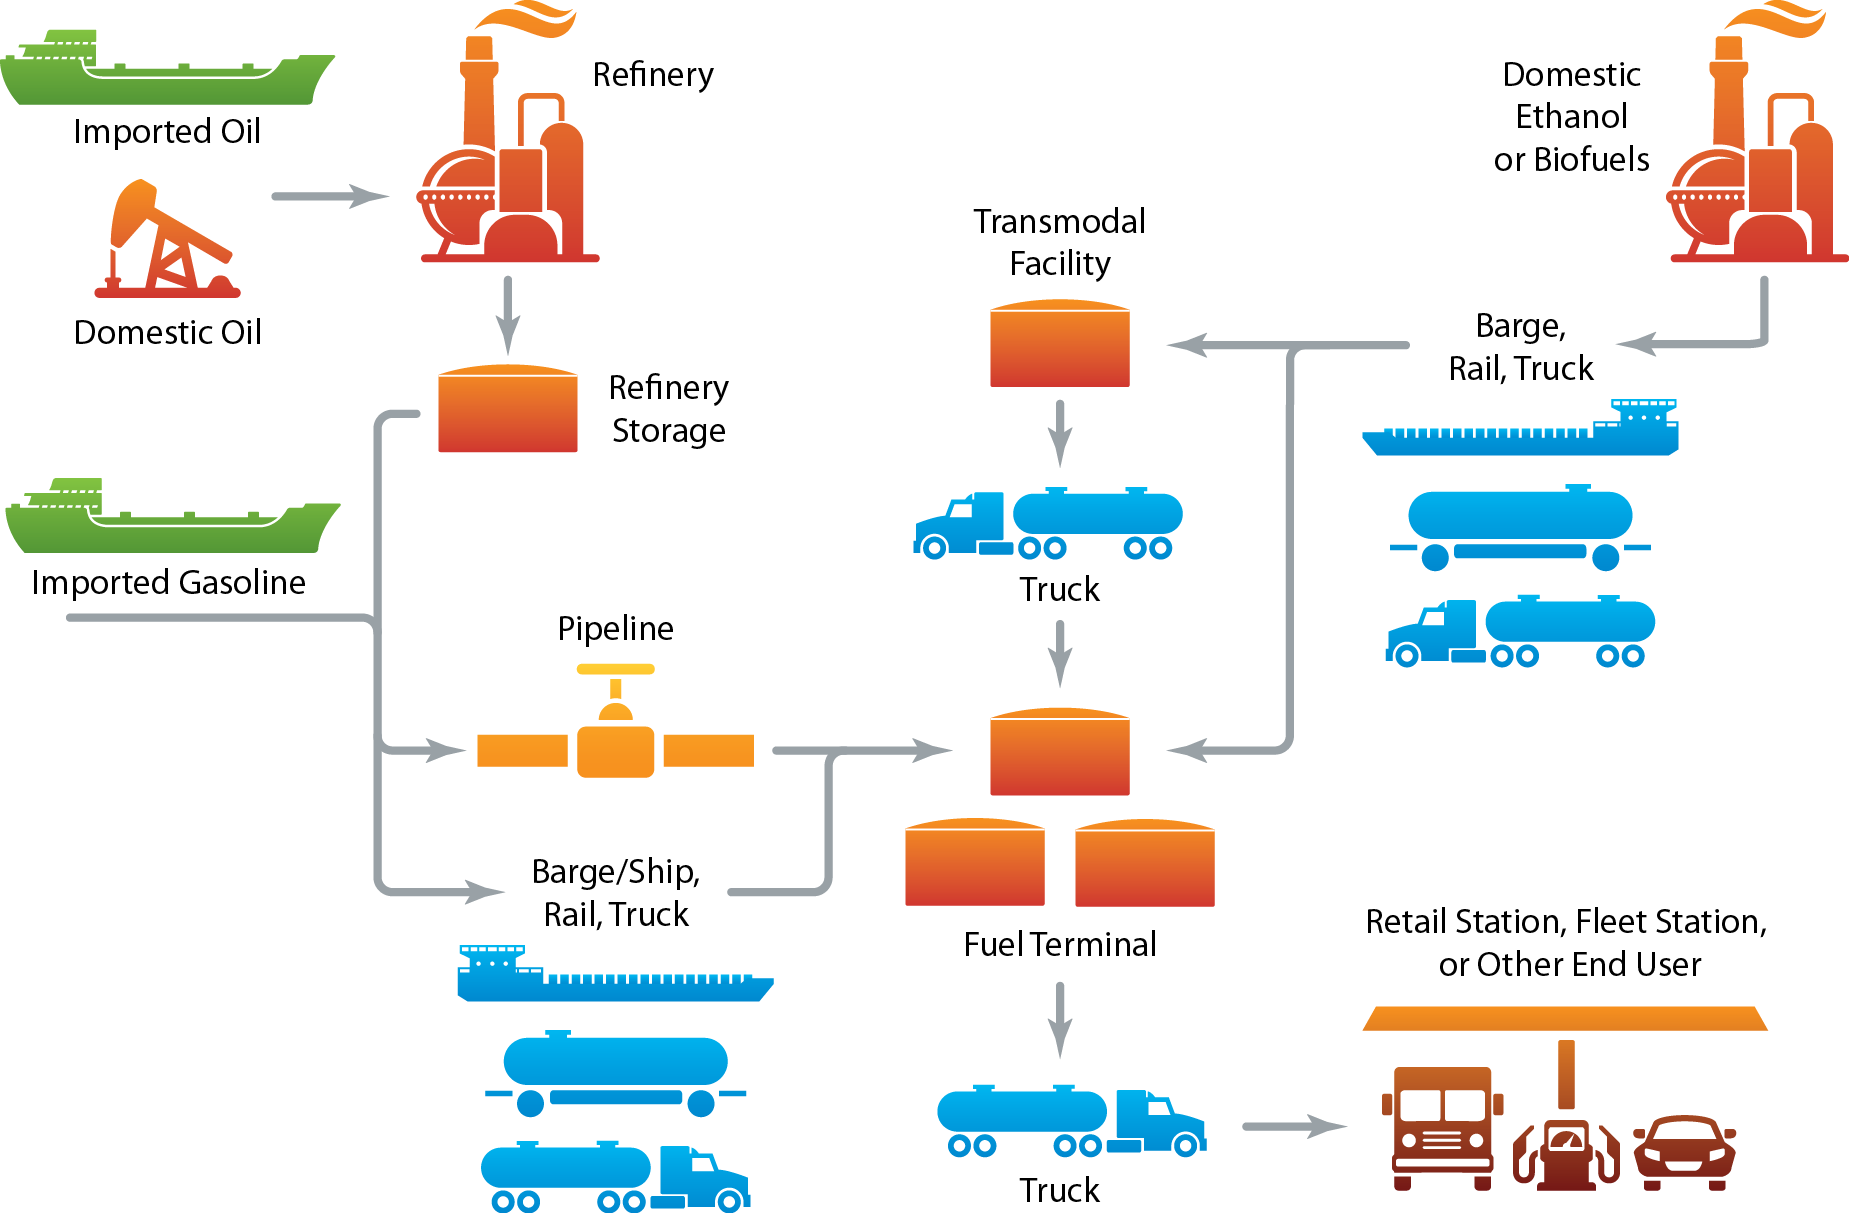
Schematic of the rail/truck ethanol distribution system. Grain is collected from farms and farm cooperatives and is trucked to an ethanol plant or biorefinery. From there, E95 goes by rail or truck to a terminal for fuel blending and storage. From the terminal, E10 or E85 is trucked to gasoline retail outlets.
Source: Dean Armstrong, National Laboratory of the Rockies
Ethanol Pipelines
Delivering ethanol by pipeline is the most efficient option, but ethanol's affinity for water and solvent properties require the use of a dedicated pipeline or significant cleanup of existing pipelines to convert them into dedicated pipelines. Kinder Morgan ships batches of ethanol through its Central Florida Pipeline. For details, see the Central Florida Pipeline Ethanol Project.