Maps and Data - Change in U.S. Vehicle Registration Counts
Find maps and charts showing transportation data and trends related to alternative fuels and vehicles.
OR
Sort by:
119 results
-
Vehicles: Fuel Consumption and Efficiency
-
-
Fuel Economy and Consumption of Light-Duty Vehicles
Relationship between fuel economy and lifetime fuel consumption for light-duty vehicles Last update May 2021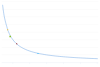
-
-
-
Fuel Economy at Various Driving Speeds
Trend of fuel efficiency at different vehicle speeds, grouped by fuel type Last update May 2021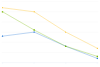
-
-
-
Fuel Use by Transportation Mode in 2019
Breakdown of fuel used in the United States by transportation mode, 2019 Last update May 2023
-
-
-
Power and Fuel Economy of the Average Light-Duty Vehicle
Trend of vehicle horsepower and fuel economy from 1975 to 2023 Last update February 2024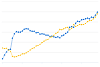
-
-
-
Vehicle Fuel Efficiency (CAFE) Requirements by Year
Trend of Corporate Average Fuel Economy (CAFE) vehicle fuel efficiency standards from 1978 to 2025 Last update September 2013
-
-
Vehicles: Vehicle Market
-
-
AFV and HEV Model Offerings, by Manufacturer
Trend of alternative fuel vehicle (AFV) and hybrid electric vehicle (HEV) models by manufacturer, 1991-2022 Last update October 2022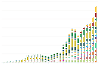
-
-
-
Efficiency Ratios for Light-Duty All-Electric Vehicles in the United States
Provides efficiency ratios of on-road all-electric vehicles in the United States in 2021, based on vehicle registration data. Last update June 2023
-
-
-
Light-Duty Vehicles Produced in the United States
Trend in the number and types of light-duty vehicles produced from 1975 to 2020 Last update May 2023
-
-
-
TransAtlas
Interactive map displays light-duty vehicle registration counts over time by state and fuel type
-
-
-
Types of Vehicles by Weight Class
Chart shows typical vehicle types within the Federal Highway Administration (FHWA) vehicle classes Last update June 2012
-
-
-
U.S. Vehicles by Transportation Mode
Breakdown of self-propelled vehicles by transportation mode in the United States (2021) Last update January 2024
-
-
-
Vehicle Weight Classes & Categories
Charts illustrate the vehicle weight classes and categories used by the Federal Highway Administration (FHWA), the U.S. Census Bureau, and the U.S. Environmental Protection Agency (EPA). Last update June 2012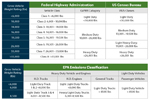
-
-
Vehicles: Driving Patterns
-
-
Annual Vehicle Miles Traveled in the United States
Trend of vehicle miles traveled from 1970 to 2023 Last update January 2024
-
-
-
Average Fuel Economy by Major Vehicle Category
Comparison of fuel economy among vehicle types Last update January 2024
-
-
-
Average Monthly Fluctuation in U.S. Vehicle Miles Traveled
U.S. vehicle miles traveled for each month of the year, averaged from 2010 to 2023 Last update December 2023
-
-
-
Average Vehicle Trip Length by Purpose (2017)
Comparison of average vehicle trip length by purpose in the United States Last update October 2022
-
-
-
Means of Transportation to Work
Trend of how people commuted to work in the United States from 1980 to 2019 Last update June 2022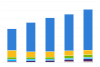
-
-
-
Share of All U.S. Vehicle Trips by Length (miles)
Breakdown of trip lengths among all vehicle trips Last update January 2024
-
-
Laws & Incentives
-
-
Biodiesel Laws and Incentives by State
Displays states and their respective law and incentive counts related to the use of biodiesel
-
-
-
Electric Vehicle Laws and Incentives by State
Displays states and their respective law and incentive counts related to electric vehicles
-
-
-
Ethanol Laws and Incentives by State
Displays states and their respective law and incentive counts related to the use of ethanol
-
-
-
Fuel Taxes by Country
Comparison of gasoline and diesel taxes in Organization for Economic Cooperation and Development countries Last update March 2019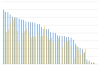
-
-
-
Hydrogen Laws and Incentives by State
Displays states and their respective law and incentive counts related to the use of hydrogen
-
-
-
Incentive Additions by Policy Type
Trend of state law and incentive enactments listed by incentive type from 2002 to 2023 Last update April 2024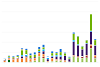
-
-
-
Law and Incentive Additions by Fuel/Technology Type
Trend of state law and incentive enactments, listed by the targeted technology or fuel type, from 2002 to 2023 Last update April 2024
-

Change in U.S. Vehicle Registration Counts
| 2016-2017 | 2017-2018 | 2018-2019 | 2019-2020 | |
| Alternative Fuel Capable | -0.311769290724864 | -3.86561424812791 | -4.73767885532591 | -5.79726396052927 |
| Compressed Natural Gas | -8.84534968969772 | -8.85858935852614 | -8.65559098362557 | -7.46064037642583 |
| Diesel | 4.69984214377891 | 1.98642744385297 | 3.16481506495663 | 3.49561962667283 |
| Electric | 25.9045643481214 | 33.6629704007684 | 26.9357279378179 | 23.11619160476 |
| Flex Fuel | 10.0338947316746 | 6.39404393887671 | 4.54777243425884 | 1.63100296477805 |
| Gasoline | 1.12594765582387 | 0.723982358720709 | 0.987537347016061 | 0.272988968877129 |
| Hybrid Electric | 7.28839886548426 | 4.86541186376394 | 6.00000132946341 | 6.25129958440303 |
| Hydrogen Fuel Cell | 59.5684803001876 | 34.0890354492993 | 62.0195694716243 | 9.37145289443814 |
| Methanol | -15.4213036565978 | -21.8992248062016 | -20.5607476635514 | -12.9287598944591 |
| Plug-In Hybrid Electric | 26.3439253095897 | 25.3166093377809 | 14.0066949724336 | 9.66259140710109 |
| Propane | 5.26315789473684 | -58.3333333333333 | -20 | 9.09090909090909 |
Source: Vehicle registration counts derived by the National Renewable Energy Laboratory with data from Experian Information Solutions
Notes: "Alternative Fuel Capable" vehicles are those with the capability of being converted to an alternative fuel. The data do not confirm whether the vehicle actually completed a conversion.
The chart illustrates the annual percent change of light-duty vehicles, by fuel type, registered in the United States from 2016 through 2020. Hydrogen fuel cell vehicles (HFCVs) consistently show the greatest growth in registration counts over the four-year period. However, the base number of vehicles was very low, and the rate of increase peaked in 2019 when the registration counts of HFCVs increased by more than 60% and has been steadily decreasing since. This is likely from increased production of the Toyota Mirai and the Honda Clarity Fuel Cell models in efforts to improve market share. Plug-in hybrid electric and electric vehicles have maintained steady growth, averaging around 35% year over year for the past four years. Annual changes are more volatile for vehicle fuel types with small populations, such as hydrogen, methanol and propane. See relative vehicle population sizes at Light-Duty AFV Registrations, AFV and HEV Model Offerings, by Manufacturer, U.S. Plug-in Electric Vehicle Sales by Model, and the Energy Information Administration's Fleet and Fuel Data. For a map comparing the density of light-duty vehicles per state and charts comparing registration counts over time, see TransAtlas.
To view more details, notes, and acronyms, please download the Excel spreadsheet.
Print