Maps and Data - Greenhouse Gas Reductions in Light- and Heavy-Duty Vehicles
Find maps and charts showing transportation data and trends related to alternative fuels and vehicles.
OR
Sort by:
119 results
-
Fuels & Infrastructure: Alternative Fueling Stations
-
-
U.S. Private Electric Vehicle Charging Infrastructure
Trend of private electric vehicle charging infrastructure in the United States from 2007 to 2023 Last update March 2024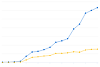
-
-
-
U.S. Public and Private Alternative Fueling Stations by Fuel Type
Trend of alternative fueling station counts by fuel type in the United States from 1992 to 2022 Last update January 2023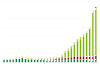
-
-
-
U.S. Public and Private Electric Vehicle Charging Infrastructure
Trend of public and private electric vehicle charging infrastructure in the United States from 2011 to 2023 Last update March 2024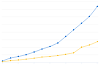
-
-
-
U.S. Public Electric Vehicle Charging Infrastructure
Trend of public electric vehicle charging infrastructure in the United States from 2007 to 2023 Last update March 2024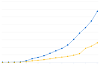
-
-
Fuels & Infrastructure: Idle Reduction
-
-
Clean Cities and Communities Energy Use Impact through Idle Reduction
Trend of energy impact by idle reduction policies and technologies from 2004 to 2022 Last update February 2024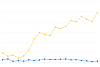
-
-
Fuels & Infrastructure: Transportation Infrastructure
-
-
Miles of U.S. Transportation Infrastructure in 2021
Distance covered by different types of transportation infrastructure in 2021 Last update January 2024
-
-
Fuels & Infrastructure: Biofuels Production
-
-
Global Ethanol Production by Country or Region
Quantity of ethanol produced by country/region from 2007 to 2022 Last update January 2024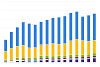
-
-
-
Legislated Renewable Fuel Standard (RFS) Volume Requirements
Displays the yearly RFS volume requirements for each renewable fuel category Last update January 2024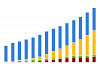
-
-
-
Renewable Fuel RFS2 Mandates and Net RINs Generated
Displays yearly Renewable Fuel Standard (RFS) mandates from Environmental Protection Agency (EPA) volume requirements, and net Renewable Identification Numbers (RINs) generated Last update April 2024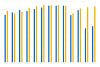
-
-
-
RFS2 Mandates and Net RINs Generated for Cellulosic Biofuels
Displays yearly Renewable Fuel Standard (RFS) mandates from Environmental Protection Agency (EPA) volume requirements, and net Renewable Identification Numbers (RINs) generated Last update April 2024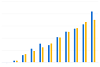
-
-
-
Total Advanced Biofuel RFS2 Mandates and Net RINs Generated
Displays yearly Renewable Fuel Standard (RFS) mandates from Environmental Protection Agency (EPA) volume requirements, and net Renewable Identification Numbers (RINs) generated Last update April 2024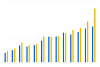
-
-
-
Total RFS2 Mandates and Net RINs Generated
Displays yearly Renewable Fuel Standard (RFS) mandates from Environmental Protection Agency (EPA) volume requirements, and net Renewable Identification Numbers (RINs) generated Last update April 2024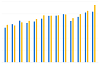
-
-
-
U.S. Biodiesel Production, Exports, and Consumption
Trend of biodiesel production, exports, and consumption from 2001 to 2023 Last update April 2024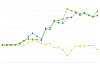
-
-
-
U.S. Corn Production and Portion Used for Fuel Ethanol
Trend of corn produced in the United States and quantity used for ethanol from 1986 to 2023 Last update January 2024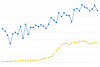
-
-
-
U.S. Corn Use by Market Year
Annual usage of the U.S. corn crop according to end product or destination Last update January 2024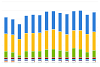
-
-
-
U.S. Ethanol Plants, Capacity, and Production
Trend of ethanol plant counts and production volumes from 1999 to 2022 Last update April 2024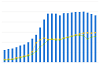
-
-
-
U.S. Production, Consumption, and Trade of Ethanol
Trend of total ethanol fuel production and consumption from 2000 to 2023 Last update April 2024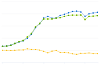
-
-
-
U.S. Soybean and Corn Prices
Trend of soybean and corn prices, adjusted for inflation, from 2002 to 2021 Last update January 2023
-
-
Vehicles
-
-
Efficiency Ratios for Light-Duty All-Electric Vehicles in the United States
Provides efficiency ratios of on-road all-electric vehicles in the United States in 2021, based on vehicle registration data. Last update June 2023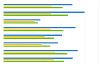
-
-
-
Electric Vehicle Registrations by State
U.S. light-duty electric vehicle population as of December 2022 Last update July 2023
-
-
-
TransAtlas
Interactive map displays light-duty vehicle registration counts over time by state and fuel type
-
-
Vehicles: AFVs and HEVs
-
-
AFV Acquisitions by Regulated Fleets (by Fleet Type)
Trend of State & Alternative Fuel Provider (S&FP) alternative fuel vehicle (AFV) acquisitions by fleet type from 1992 to 2022 Last update June 2023
-
-
-
AFV Acquisitions by Regulated Fleets (by Fuel Type)
Trend of State & Alternative Fuel Provider (S&FP) alternative fuel vehicle (AFV) acquisitions by fuel type from 1992 to 2022 Last update June 2023
-
-
-
AFV and HEV Model Offerings, by Manufacturer
Trend of alternative fuel vehicle (AFV) and hybrid electric vehicle (HEV) models by manufacturer, 1991-2024 Last update May 2024
-
-
-
Annual Vehicle Credits Earned and Used by Regulated Fleets
Trend of State & Alternative Fuel Provider (S&FP) EPAct credits traded and transactions from 1999 to 2022 Last update June 2023
-

Greenhouse Gas Reductions in Light- and Heavy-Duty Vehicles
| Gasoline | Diesel | Propane | LNG | CNG | Ethanol (Corn) | H2 (SMR) | Electricity | Biodiesel | Renewable Diesel | RNG (Landfill) | Fuel Economy | Idle Reduction | VMT Reduction | RNG (Animal) | RNG (Wastewater) | |
| Light-Duty Vehicles | 0 | -13 | -16 | -40 | -43 | -61 | -68 | -80 | -84 | -100 | -100 | -100 | -130 | -146 | ||
| Heavy-Duty Vehicles | 0 | 3 | -3 | -7 | -46 | -61 | -61 | -76 | -83 | -100 | -100 | -100 | -133 | -151 |
Source: Derived from AFLEET 2020 for the Clean Cities and Communities Coalition Network. Data reflect input values deemed applicable to the average or majority of U.S. drivers at a national level.
This figure compares the greenhouse gases (GHGs) emitted by various fuels over their lifecycle when achieving the same transportation objectives. Propane and CNG emit 13% and 16% fewer GHGs than conventional gasoline in light-duty vehicles (LDVs). Corn ethanol and hydrogen produced from steam-methane reforming (currently the most common source of hydrogen) both reduce emissions about 40% over their lifecycles. Electricity (assuming the nationwide average grid mix) and biodiesel both reduce emissions by more than 60%. Fuel economy, idle reduction, and VMT-reduction projects all reduce GHG emissions 100% because they have no alternative or upstream emissions. Renewable natural gas reduces emissions by 84%-146%, depending on the source, because these projects keep methane from venting to the atmosphere. Greenhouse gas reductions from heavy-duty vehicles (HDVs) are similar to those of LDVs, but slightly smaller because diesel engines (which are the baseline for this chart) are more efficient than gasoline engines.
To view more details, notes, and acronyms, please download the Excel spreadsheet.
Print