Maps and Data - Greenhouse Gas Reductions in Light- and Heavy-Duty Vehicles
Find maps and charts showing transportation data and trends related to alternative fuels and vehicles.
OR
Sort by:
119 results
-
Vehicles: AFVs and HEVs
-
-
Biodiesel Purchases by EPAct-Regulated Fleets
Trend of State and Alternative Fuel Provider Biodiesel Purchases from 2000 to 2022 Last update June 2023
-
-
-
Clean Cities and Communities Alternative Fuel Vehicle Inventory
Alternative fuel vehicle inventory reported by Clean Cities and Communities coalitions from 2004 to 2022 Last update February 2024
-
-
-
Clean Cities and Communities Energy Use Impact by AFV Type
Trend of energy impact by fuels used in alternative fuel vehicles (AFVs) from 2004 to 2022 Last update February 2024
-
-
-
Efficiency Ratios for Light-Duty All-Electric Vehicles in the United States
Provides efficiency ratios of on-road all-electric vehicles in the United States in 2021, based on vehicle registration data. Last update June 2023
-
-
-
EPAct State & Alternative Fuel Provider Fleet Exemptions
Trend of State & Alternative Fuel Provider (S&FP) exemption requests and vehicles exempted from 1997 to 2022 Last update June 2023
-
-
-
Light-Duty AFV, HEV, and Diesel Model Offerings, by Technology/Fuel
Trend of vehicle models incorporating various advanced technologies or alternative fuels, from 1991 through 2022 Last update January 2023
-
-
-
Light-Duty AFV Registrations
Breakdown of alternative fuel vehicle (AFV) registrations by fuel type Last update May 2024
-
-
-
TransAtlas
Interactive map displays light-duty vehicle registration counts over time by state and fuel type
-
-
-
Transit Buses by Fuel Type
Trend of buses powered by various fuels in the United States, 2007-2021 Last update April 2024
-
-
-
Types of Vehicles by Weight Class
Chart shows typical vehicle types within the Federal Highway Administration (FHWA) vehicle classes Last update June 2012
-
-
-
U.S. HEV Sales by Model
Trend of sales by hybrid electric vehicle (HEV) model, 1999-2019 Last update January 2020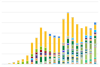
-
-
-
U.S. Plug-in Electric Vehicle Sales by Model
Trend of sales by PEV model, 2011-2019 Last update January 2020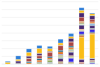
-
-
-
Vehicle Credits Traded by Regulated Fleets
Trend of State & Alternative Fuel Provider (S&FP) EPAct credits traded and transactions from 1997 to 2022 Last update June 2023
-
-
-
Vehicle Weight Classes & Categories
Charts illustrate the vehicle weight classes and categories used by the Federal Highway Administration (FHWA), the U.S. Census Bureau, and the U.S. Environmental Protection Agency (EPA). Last update June 2012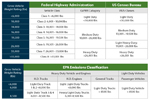
-
-
Vehicles: Fuel Consumption and Efficiency
-
-
Average Annual Fuel Use by Vehicle Type
Comparison of fuel use (per vehicle) among vehicle types Last update May 2024
-
-
-
Average Annual Vehicle Miles Traveled by Major Vehicle Category
Comparison of miles traveled (per vehicle) among vehicle types Last update January 2024
-
-
-
Average Fuel Consumption at Increasing Road Grades
Trend of fuel consumption at increasing road grades, for various vehicle types Last update August 2014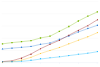
-
-
-
Average Fuel Economy by Major Vehicle Category
Comparison of fuel economy among vehicle types Last update January 2024
-
-
-
Average Per-Passenger Fuel Economy by Travel Mode
Comparison of per-passenger fuel economy for various modes of transportation Last update October 2022
-
-
-
Clean Cities and Communities Energy Use Impact by VMT Reduction and FE
Trend of energy impact by fuel economy (FE) improvements and reductions in vehicle miles traveled (VMT) from 2004 to 2022 Last update February 2024
-
-
-
Clean Cities and Communities Energy Use Impact through Idle Reduction
Trend of energy impact by idle reduction policies and technologies from 2004 to 2022 Last update February 2024
-
-
-
Composition of New U.S. Light-Duty Vehicles by Vehicle Type
Trend showing the shift in popularity of trucks versus cars by year Last update January 2024
-
-
-
Efficiency Ratios for Light-Duty All-Electric Vehicles in the United States
Provides efficiency ratios of on-road all-electric vehicles in the United States in 2021, based on vehicle registration data. Last update June 2023
-
-
-
Energy Expenditures by Sector
Trend of U.S. transportation and residential energy expenditures, per capita, from 1970 to 2021 Last update January 2024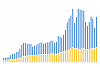
-
-
-
Energy Losses in Light-Duty Gasoline Vehicles
Breakdown of energy lost to various factors in light-duty vehicles Last update January 2024
-

Greenhouse Gas Reductions in Light- and Heavy-Duty Vehicles
| Gasoline | Diesel | Propane | LNG | CNG | Ethanol (Corn) | H2 (SMR) | Electricity | Biodiesel | Renewable Diesel | RNG (Landfill) | Fuel Economy | Idle Reduction | VMT Reduction | RNG (Animal) | RNG (Wastewater) | |
| Light-Duty Vehicles | 0 | -13 | -16 | -40 | -43 | -61 | -68 | -80 | -84 | -100 | -100 | -100 | -130 | -146 | ||
| Heavy-Duty Vehicles | 0 | 3 | -3 | -7 | -46 | -61 | -61 | -76 | -83 | -100 | -100 | -100 | -133 | -151 |
Source: Derived from AFLEET 2020 for the Clean Cities and Communities Coalition Network. Data reflect input values deemed applicable to the average or majority of U.S. drivers at a national level.
This figure compares the greenhouse gases (GHGs) emitted by various fuels over their lifecycle when achieving the same transportation objectives. Propane and CNG emit 13% and 16% fewer GHGs than conventional gasoline in light-duty vehicles (LDVs). Corn ethanol and hydrogen produced from steam-methane reforming (currently the most common source of hydrogen) both reduce emissions about 40% over their lifecycles. Electricity (assuming the nationwide average grid mix) and biodiesel both reduce emissions by more than 60%. Fuel economy, idle reduction, and VMT-reduction projects all reduce GHG emissions 100% because they have no alternative or upstream emissions. Renewable natural gas reduces emissions by 84%-146%, depending on the source, because these projects keep methane from venting to the atmosphere. Greenhouse gas reductions from heavy-duty vehicles (HDVs) are similar to those of LDVs, but slightly smaller because diesel engines (which are the baseline for this chart) are more efficient than gasoline engines.
To view more details, notes, and acronyms, please download the Excel spreadsheet.
Print